Our sports visualisation pedigree
All our sports projects generate new editorial formats to engage fans. These formats are then integrated into our client’s primary platforms and social channels, creating lasting value as opposed to one-off content visualisations.
This project builds on previous work for UEFA Champions League as well as work for BBC Sport covering the Cricket World Cup and sponsored content on the NZ All Blacks for AIG.
Narrative, not numbers
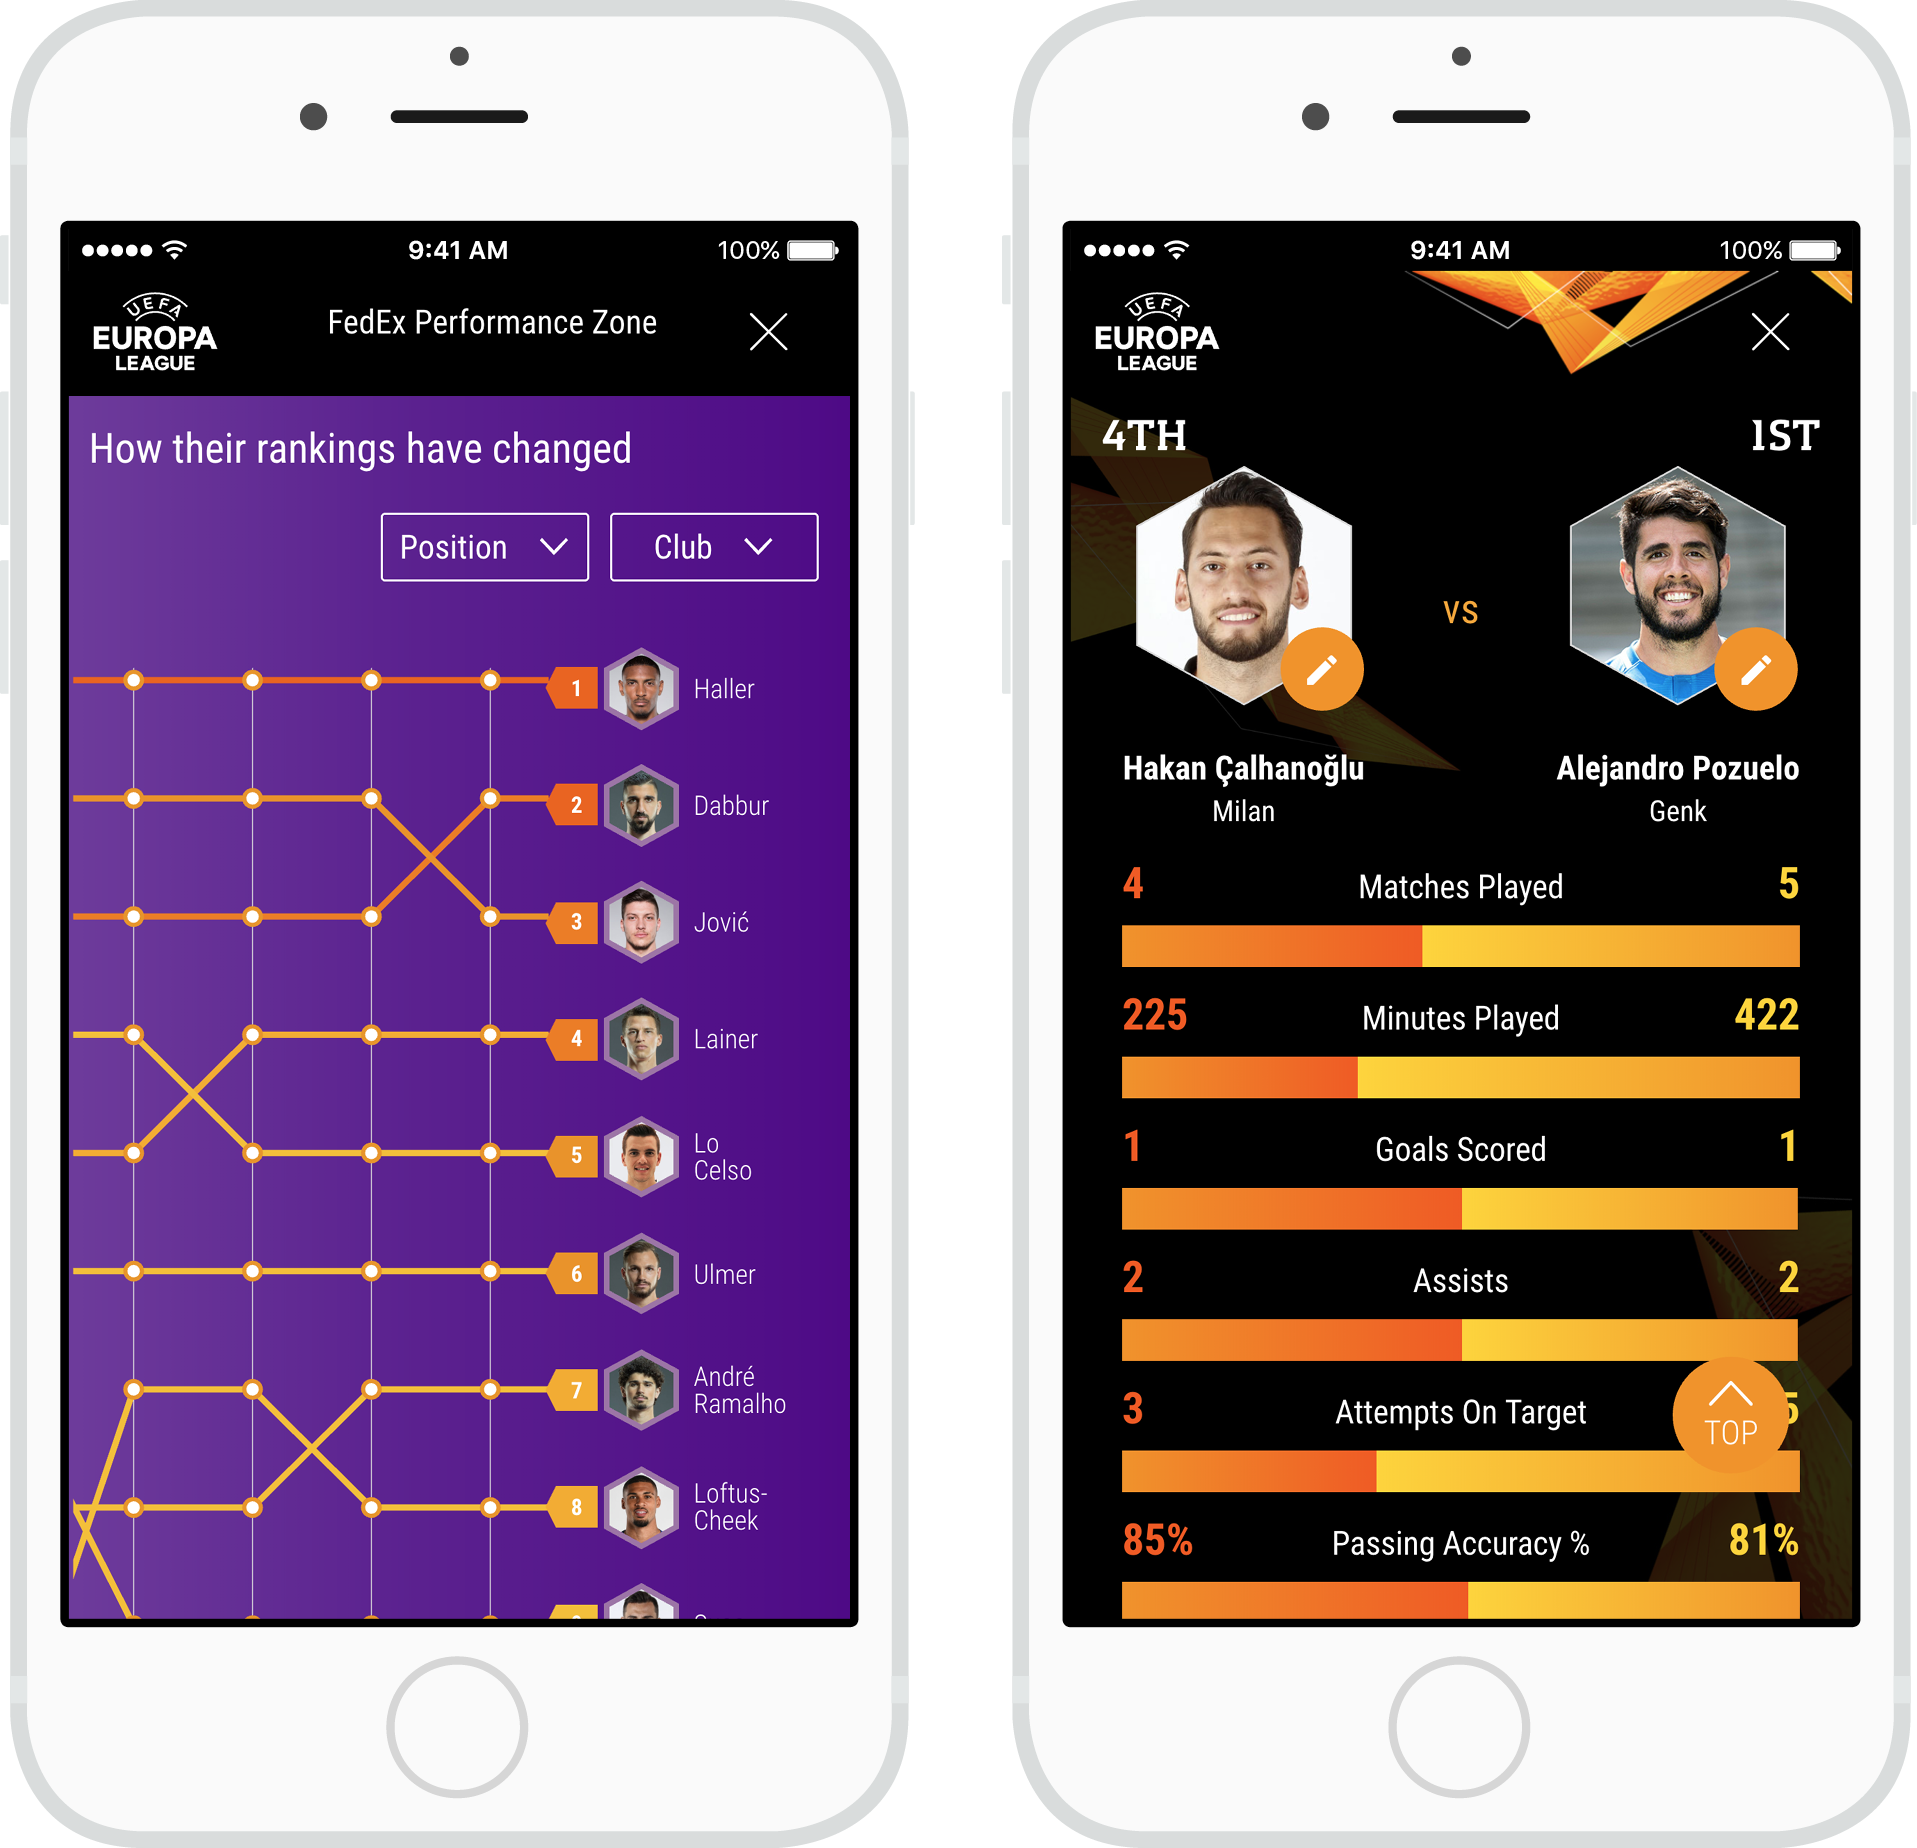
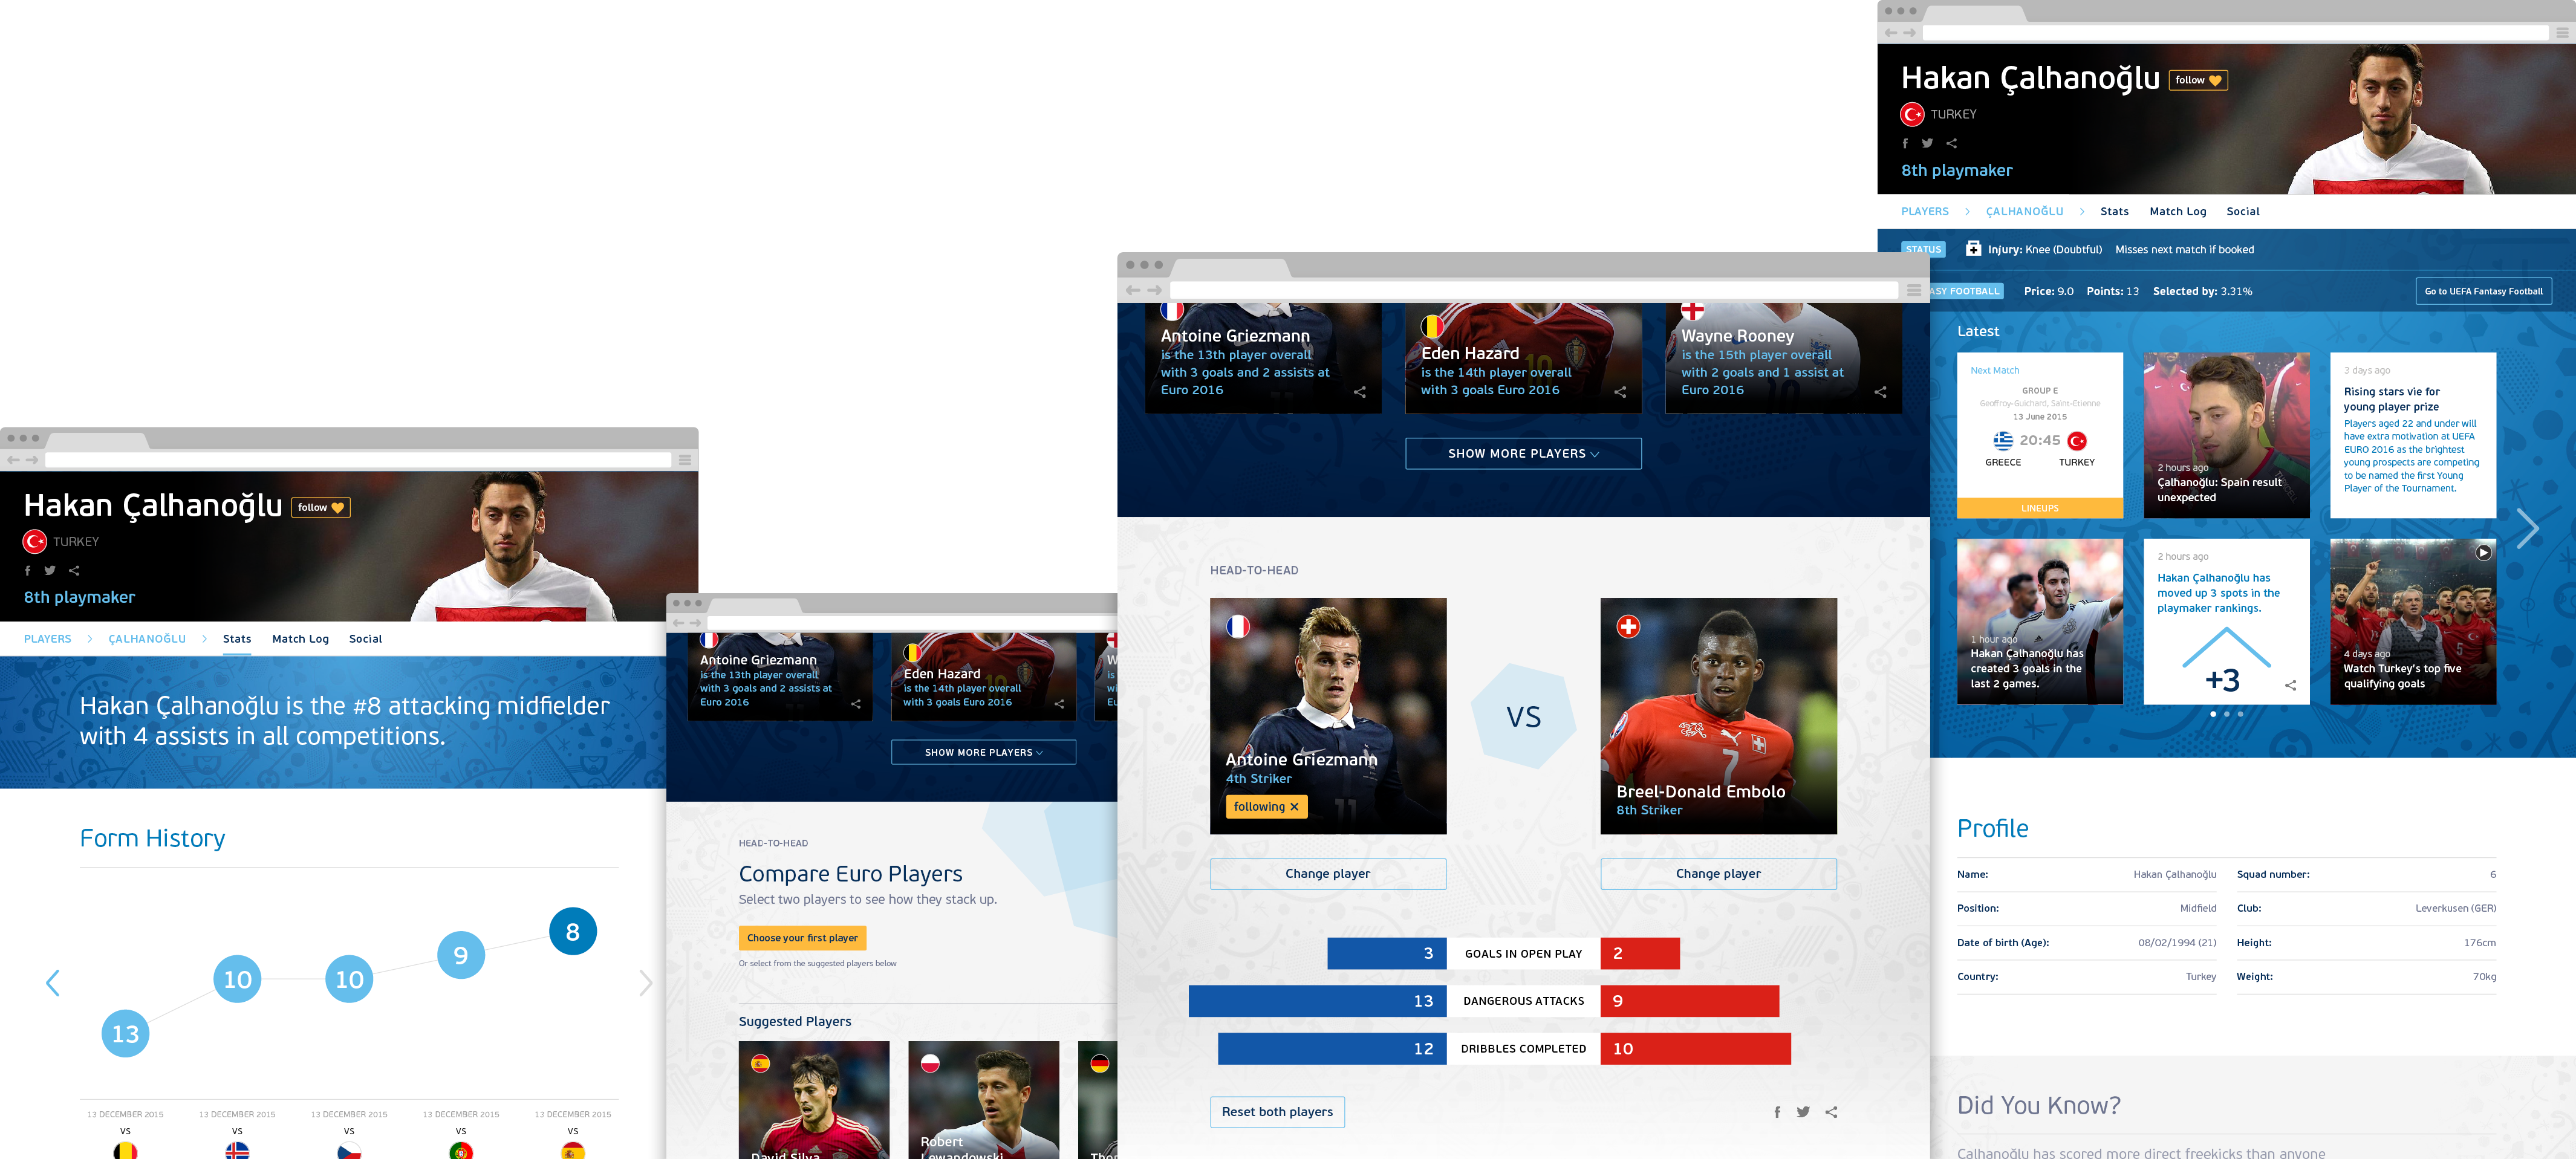
The Player Barometer presents a new type of player rankings that lets UEFA own the debate about the best players by showing ‘player cards’ built on new player metadata to construct a live ranking that is updated at the end of every match.
One concept we explored was how to humanise the data with ‘natural language’ output, creating a set of simple sentence structures that could provide a huge variety of outputs. We eschewed more complex visualisations to create something that would work for non-experts and across a variety of devices.

Digging into the material
The Player Barometer presents a new type of player rankings that lets UEFA own the debate about the best players. The Player Barometer uses a combination of the player cards and new player metadata to construct a live ranking that is updated at the end of every match.

Cards, cards, cards!
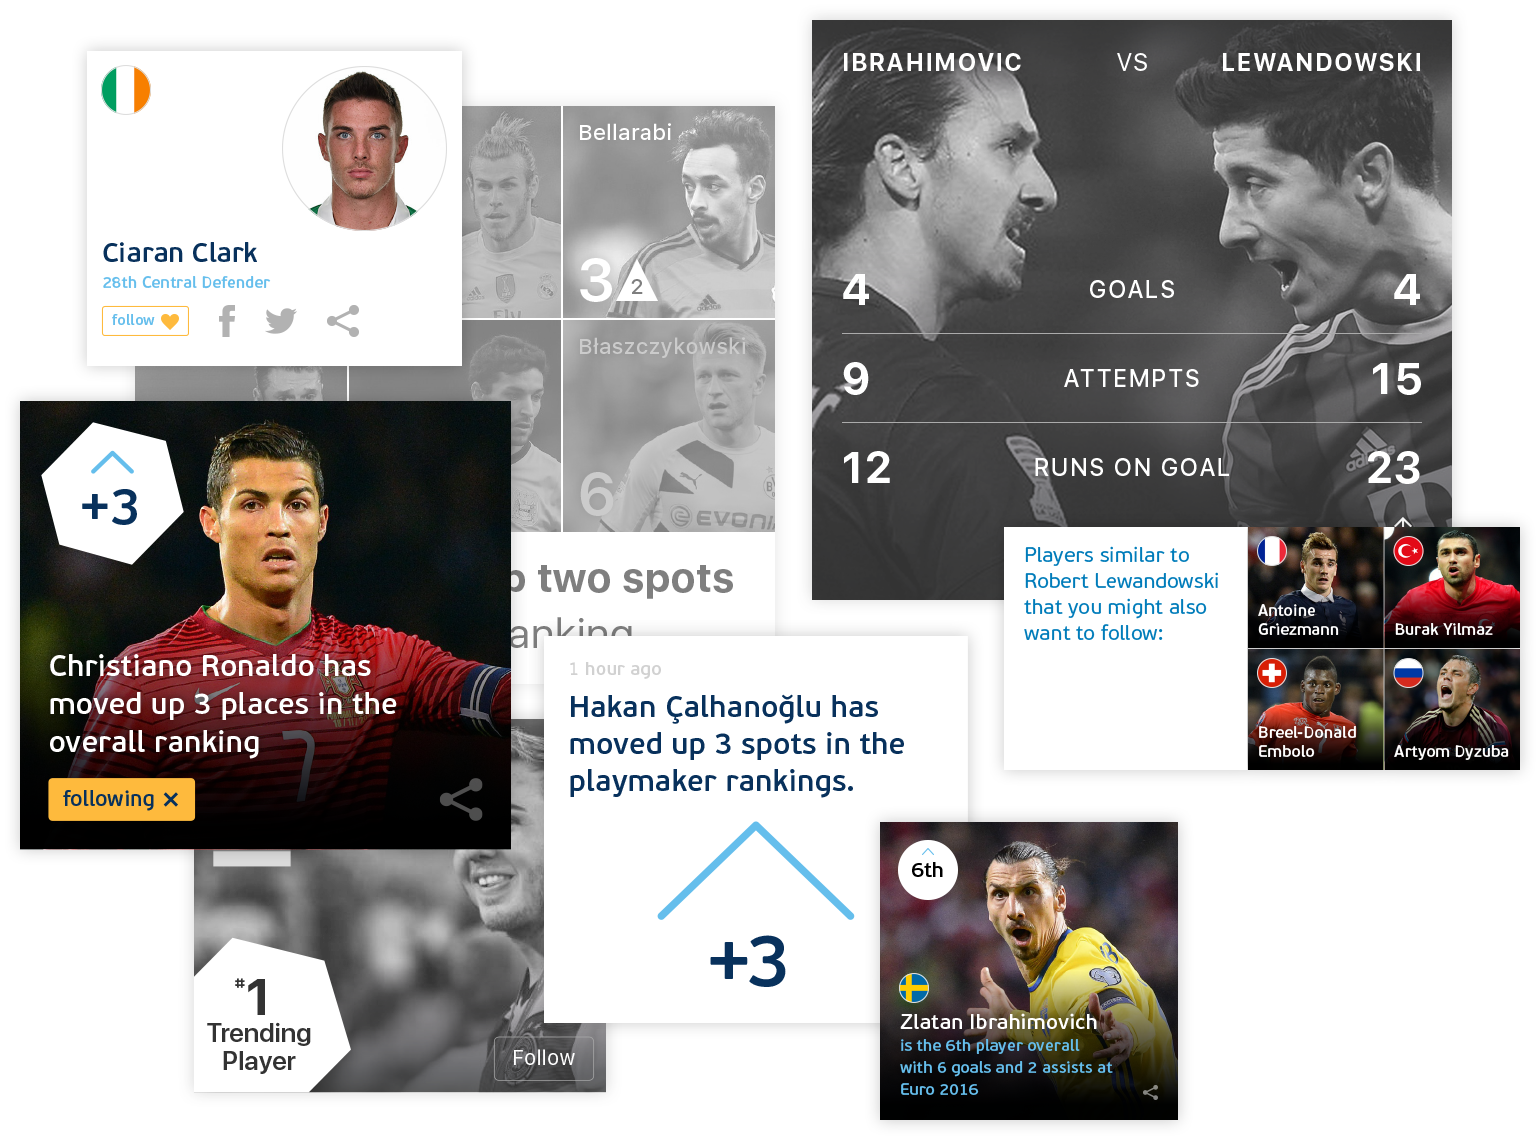
Going beyond the metadata, we also developed a variety of card formats that could be syndicated across UEFA’s websites and social media channels. Highly modular, the player card formats we developed could be reused by UEFA’s internal product teams in a variety of contexts.

Creating a publishing platform
The formats we designed continue to be used by UEFA: the Player Barometer is currently used for the Europa League and our Champions League Pitch View has created thousands of automatic visualisations over the last 5 years. When creating new editorial formats one of our main goals is for them to generate content that lives within the primary channels of the site, i.e. in news stories on the homepage, in live match feeds, or on social channels, instead of being cordoned off into a ‘stats’ area, because this helps a larger set of users experience these new formats.

